Support and resistance: the basics of price levels
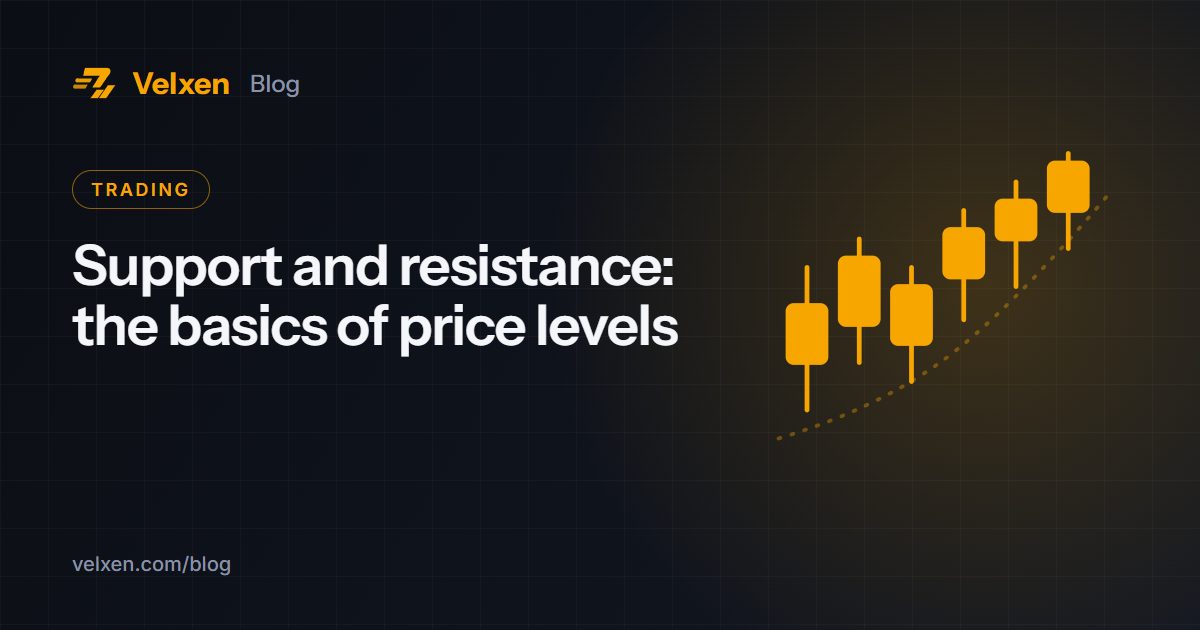
Prices do not move in straight lines. They often stall or bounce at the same levels again and again. Traders call these levels support and resistance.
Support
Support is a price level where buying has been strong enough to stop a fall. Think of it as a floor. When the price comes back to it, buyers often step in again.
Resistance
Resistance is a level where selling has stopped a rise, like a ceiling. When the price returns to it, sellers often appear.
How to find them
- Look for places on the chart where the price turned more than once.
- Use the daily or 4-hour chart first; levels on bigger timeframes are stronger.
- Round numbers (such as 60,000 for BTC) often act as levels because many people place orders there.
- Draw a horizontal line with the drawing tools on the Velxen chart.
Role reversal
When the price breaks above resistance, that level often becomes support. When it breaks below support, it often becomes resistance. This is one of the most useful patterns to know.
Using levels to plan
Many traders place buy limit orders near support, take-profit orders near resistance and a stop just beyond the level in case it breaks. Levels are not guarantees, so always decide in advance what you will do if the price goes the other way.
This article is for education only and is not financial advice. Crypto prices can rise and fall sharply; only trade with money you can afford to lose.