Moving averages: how to spot the trend
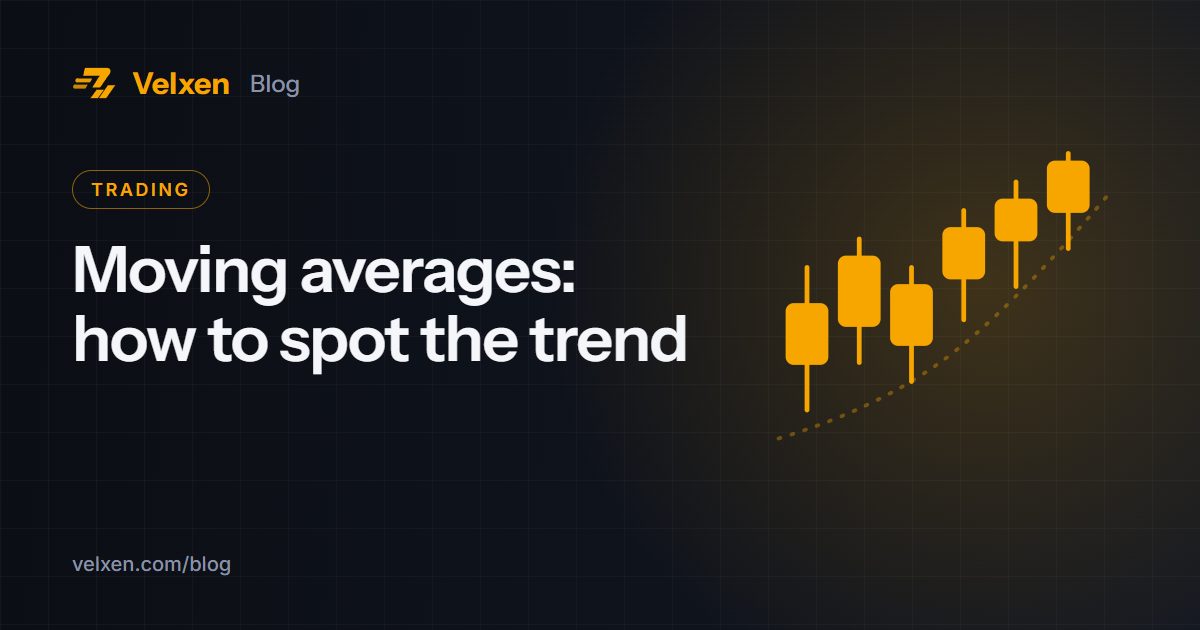
A moving average (MA) is the average price over a number of recent candles, redrawn as each new candle closes. It turns a noisy chart into a smooth line that shows the direction of the trend.
Simple and exponential
- Simple moving average (SMA): every candle in the period counts equally.
- Exponential moving average (EMA): recent candles count more, so it reacts faster.
Popular settings
- 20 EMA: short-term trend, often used by swing traders.
- 50 SMA: medium-term trend.
- 200 SMA: the long-term trend; many traders see price above the 200 as a healthy market.
Reading moving averages
- Price above a rising MA suggests an uptrend; below a falling MA suggests a downtrend.
- In strong trends, the MA often acts as moving support or resistance.
- When a short MA crosses above a long MA (for example 50 over 200), traders call it a golden cross; the opposite is a death cross.
Limits
Moving averages lag behind price because they are built from past candles. In sideways markets they cross back and forth and give many false signals.
Add one on Velxen
Open the full-screen chart, choose Indicators, search "Moving Average" and set the length. Try a 50 and a 200 together on the daily chart.
This article is for education only and is not financial advice. Crypto prices can rise and fall sharply; only trade with money you can afford to lose.
Trade on Velxen390+ coins, a 0.10% fee and escrow-protected P2P.
Open free account