How to read a candlestick chart
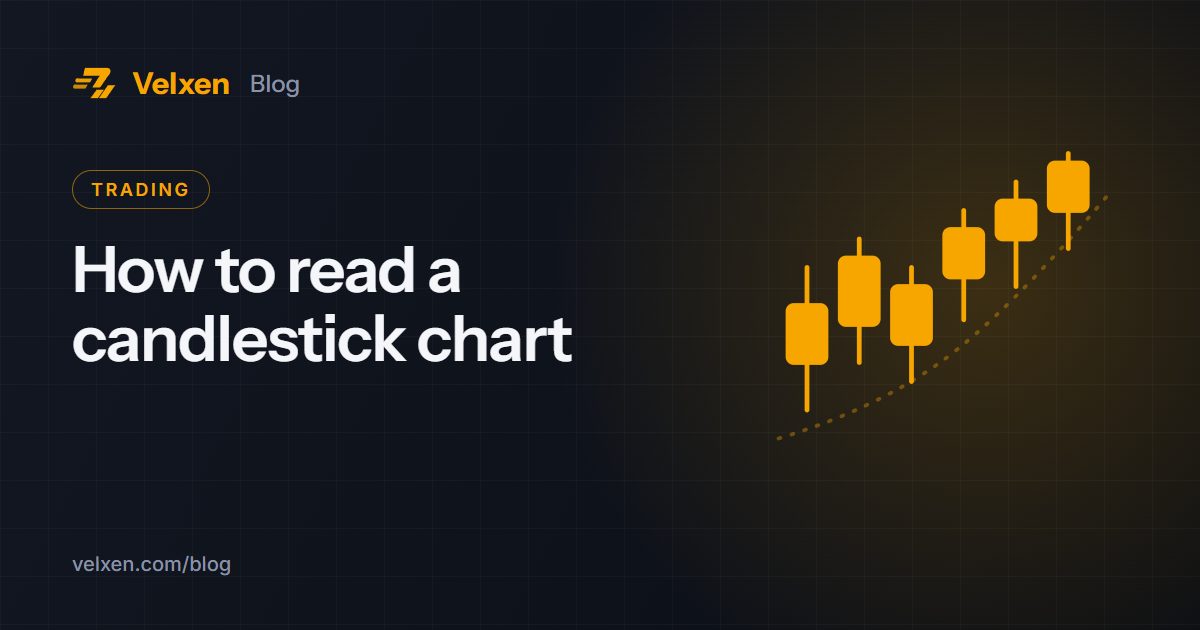
Every price chart on Velxen uses candlesticks. Each candle tells you four prices for one period of time, such as one hour or one day.
The parts of a candle
- Body: the range between the opening price and the closing price.
- Wicks (the thin lines): the highest and lowest prices reached in that period.
- Colour: green when the price closed higher than it opened, red when it closed lower.
What candles can tell you
- A long green body shows strong buying during that period.
- A long red body shows strong selling.
- A long upper wick means buyers pushed the price up but sellers pushed it back down.
- A long lower wick means sellers pushed down but buyers stepped in.
- A tiny body with wicks on both sides (a doji) shows indecision.
Timeframes matter
The same market can look very different on a 5-minute chart and a daily chart. Short timeframes show noise; long timeframes show the bigger trend. Many traders check the daily chart first, then zoom in.
Practise on Velxen
Open the full-screen chart, switch between 15m, 1h, 4h and 1D at the top, and watch how the same move looks at each scale. Charting is provided by TradingView.
This article is for education only and is not financial advice. Crypto prices can rise and fall sharply; only trade with money you can afford to lose.
Trade on Velxen390+ coins, a 0.10% fee and escrow-protected P2P.
Open free account